【prometheus】-06 Kubernetes云原生监控之cAdvisor容器资源监控
【prometheus】-05 Kubernetes云原生监控之节点性能监控

【prometheus】-04 轻松搞定Prometheus Eureka服务发现

【prometheus】-03 轻松搞定Prometheus文件服务发现

【prometheus】-02 一张图彻底搞懂Prometheus服务发现机制


Kubernetes监控接入之cAdvisor容器资源监控
概述
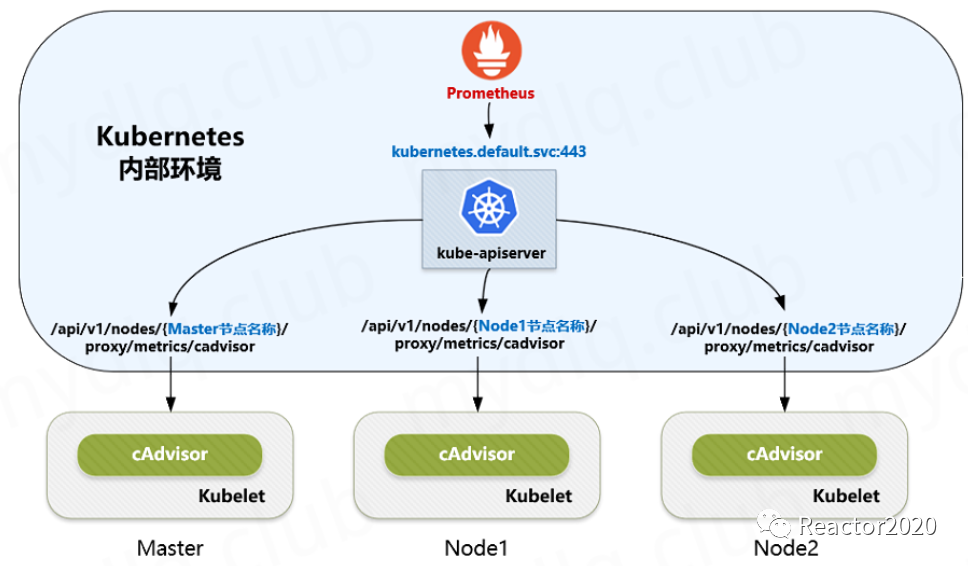
Kubernetes 云原生集群监控主要涉及到如下三类指标:node 物理节点指标、pod & container 容器资源指标和Kubernetes 云原生集群资源指标。针对这三类指标都有比较成熟的方案,见下图:

上节我们整理了node性能指标如何监控,这一节我们就来分析下cAdvisor性能指标监控。
cAdvisor(Container Advisor) 是 Google 开源的一个容器监控工具,可用于对容器资源的使用情况和性能进行监控。它以守护进程方式运行,用于收集、聚合、处理和导出正在运行容器的有关信息。具体来说,该组件对每个容器都会记录其资源隔离参数、历史资源使用情况、完整历史资源使用情况的直方图和网络统计信息。cAdvisor 本身就对 Docker 容器支持,并且还对其它类型的容器尽可能的提供支持,力求兼容与适配所有类型的容器。
由以上介绍我们可以知道,cAdvisor 是用于监控容器引擎的,由于其监控的实用性,Kubernetes 已经默认将其与 Kubelet 融合,所以我们无需再单独部署 cAdvisor 组件来暴露节点中容器运行的信息,直接使用 Kubelet 组件提供的指标采集地址即可。
环境信息
本人搭建的 Kubernetes 集群环境如下图,后续都是基于该集群演示:

Prometheus接入
1、访问Prometheus API方式检查:
kubectl?get?--raw?/api/v1/nodes/${1}/proxy/metrics/cadvisor
2、创建Prometheus抓取任务job:
??-?job_name:?kubernetes-nodes-cadvisor
????metrics_path:?/metrics
????scheme:?https
????kubernetes_sd_configs:
????-?role:?node
??????api_server:?https://apiserver.simon:6443
??????bearer_token_file:?/tools/token.k8s
??????tls_config:
????????insecure_skip_verify:?true
????bearer_token_file:?/tools/token.k8s
????tls_config:
??????insecure_skip_verify:?true
????relabel_configs:
????#?将标签(.*)作为新标签名,原有值不变
????-?action:?labelmap
??????regex:?__meta_kubernetes_node_label_(.*)
????#?修改NodeIP:10250为APIServerIP:6443
????-?action:?replace
??????regex:?(.*)
??????source_labels:?["__address__"]
??????target_label:?__address__
??????replacement:?192.168.52.151:6443?#apiserver
????-?action:?replace
??????source_labels:?[__meta_kubernetes_node_name]
??????target_label:?__metrics_path__
??????regex:?(.*)
??????replacement:?/api/v1/nodes/${1}/proxy/metrics/cadvisor??
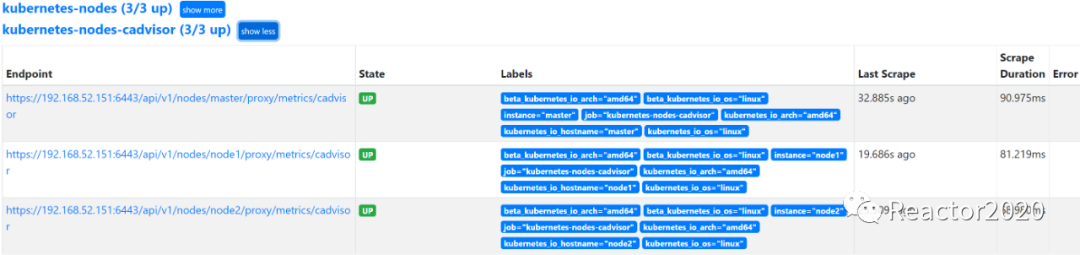
3、检查是否接入成功:
4、cAdvisor组件抓取指标列表:
container_fs_write_seconds_total{}
container_memory_swap{}
container_spec_cpu_shares{}
container_ulimits_soft{}
container_fs_io_current{}
container_fs_reads_bytes_total{}
container_fs_writes_merged_total{}
container_cpu_user_seconds_total{}
container_memory_failcnt{}
container_memory_failures_total{}
container_cpu_cfs_throttled_seconds_total{}
container_cpu_usage_seconds_total{}
container_fs_io_time_seconds_total{}
container_network_receive_packets_total{}
container_spec_memory_reservation_limit_bytes{}
cadvisor_version_info{}
container_cpu_cfs_periods_total{}
container_fs_limit_bytes{}
container_fs_sector_writes_total{}
container_memory_usage_bytes{}
container_memory_working_set_bytes{}
container_network_receive_errors_total{}
container_network_transmit_packets_dropped_total{}
container_spec_cpu_period{}
container_file_descriptors{}
container_fs_inodes_total{}
container_fs_usage_bytes{}
container_network_transmit_packets_total{}
container_cpu_load_average_10s{}
container_fs_writes_bytes_total{}
container_memory_cache{}
container_spec_cpu_quota{}
container_cpu_cfs_throttled_periods_total{}
container_network_receive_bytes_total{}
container_network_transmit_errors_total{}
container_sockets{}
container_spec_memory_swap_limit_bytes{}
container_threads{}
container_threads_max{}
container_cpu_system_seconds_total{}
container_fs_read_seconds_total{}
container_fs_reads_merged_total{}
container_fs_sector_reads_total{}
container_processes{}
container_spec_memory_limit_bytes{}
container_fs_inodes_free{}
container_network_receive_packets_dropped_total{}
container_network_transmit_bytes_total{}
container_fs_io_time_weighted_seconds_total{}
container_fs_reads_total{}
container_fs_writes_total{}
container_memory_max_usage_bytes{}
container_memory_rss{}
container_scrape_error{}
container_start_time_seconds{}
container_last_seen{}
container_memory_mapped_file{}
container_tasks_state{}
dashboard配置
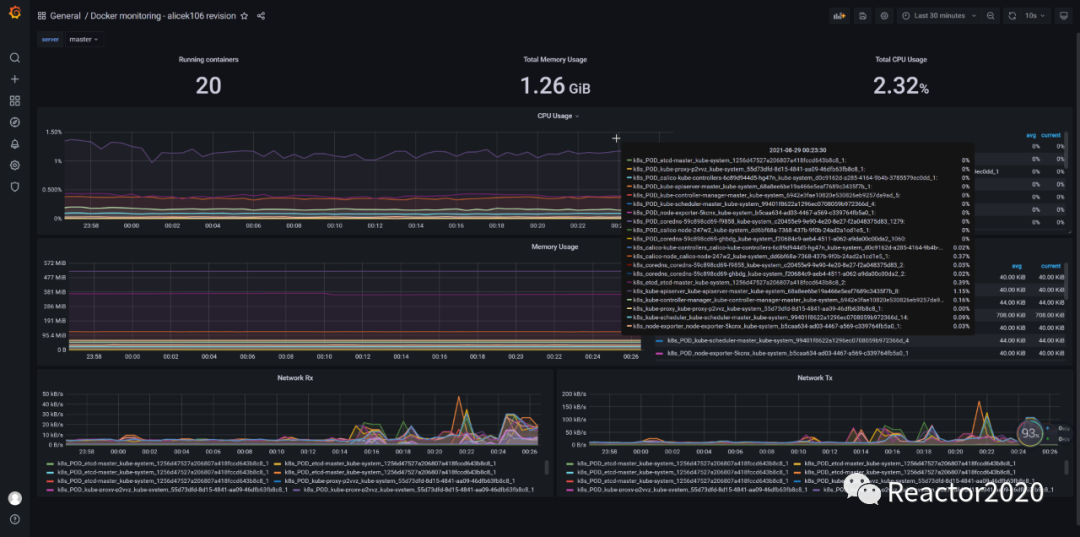
导入3125 或 13025 dashboard,cAdvisor性能监控指标就展示到模板上,如下图:

本文来自互联网用户投稿,该文观点仅代表作者本人,不代表本站立场。本站仅提供信息存储空间服务,不拥有所有权,不承担相关法律责任。 如若内容造成侵权/违法违规/事实不符,请联系我的编程经验分享网邮箱:chenni525@qq.com进行投诉反馈,一经查实,立即删除!
- 亚马逊鲲鹏系统给我带来的真实体验感
- GNN Torch functions
- pytorch中nonzero()的用法
- fill的用法
- Pytorch中torch.nonzero()函数解析
- ECMAScript 6 Promise - 通过Promise输出题理解Promise
- java 集成 layIm 聊天工具
- Sql server 日期转换处理大全
- 宝塔面板部署laravel项目填坑总结[持续更新]
- Redis哈希槽,对于哈希槽的理解,以及高并发情况下哈希槽不够的情况讲解,热点缓存的解决思路
- npm依赖包bin文件路径问题
- 抖店一件代发怎么做?需要粉丝基数吗?
- mac系统下配置域名映射关系
- 【C++】String类的实现
- 安全用电监测预警系统-保障电力设施安全运行